需求
数据输入为 counter 类型的指标 demo_tasks__count
实现方式:increase(...) 函数计算某个时段的增量,如 increase(demo_tasks__count[5m]) 计算 5min 内的增量,且会处理 counter 置零的场景
问题
increase() 函数计算结果经常为小数,且与实际该时段内的任务增量不同
初步调研
Prometheus 做 rate 计算时会进行外推 extrapolation,导致出现小数
见讨论:
- https://stackoverflow.com/questions/38665904/why-does-increase-return-a-value-of-1-33-in-prometheus
- https://groups.google.com/g/prometheus-users/c/_aK7im7elUs
- https://groups.google.com/g/prometheus-users/c/qmutsg1c55g
Prometheus 官方专门写了一篇 blog 解释 rate 的计算过程,值得仔细阅读:Blog - How Exactly Does PromQL Calculate Rates?1
Take-away
- Prometheus 进行 rate 计算时会进行外推 extrapolation,产生小数
- Prometheus PromQL 当前不适合进行整数类的数据统计,如一段时间的请求数、任务数,Victoria Metrics 可以
尝试解决方案
从邮件组讨论中得到一个神秘公式 https://groups.google.com/g/prometheus-users/c/DhoigmwGx5Q/m/5s3My1EzBAAJ
increase(metric[5m + scrape_interval]) * 5m / (5m + scrape_interval)
套用在现有的数据里测试,发现可以工作!
为什么该公式可以工作
increase(metric[5m + scrape_interval]) * 5m / (5m + scrape_interval)
先看 Prometheus 的 rate 计算过程 Blog - How Exactly Does PromQL Calculate Rates?1
为了得到区间内的数值增量,一个简单的想法是
increase(metric[5m]) / 5m * (5m - scrape_interval)但
increase(metric[5m]) / 5m * (5m - scrape_interval)有致命性问题,也是 Prometheus 试图通过外推去弥补的:丢失区间中的差值
我们需要算出来的是当前区间及之前的 1 个 datapoint 的差值!这也正是 Victoria Metrics increase 的实现方案
通过加上 1 个 scape_interval
metric[5m + scrape_interval],可以涵盖区间前一个点,于是产生了公式increase(metric[5m + scrape_interval]) * 5m / (5m + scrape_interval)
5m 指 step interval还有遗漏的地方吗?extrapolation 的两类特殊情况,这两种情况是否影响该公式的准确性?
- 指标在 time window 内开始或结束:the extrapolation only extends half an average sample interval toward the window boundary
- 负值不会外推:extrapolation only happens until the expected
0 value is hit
扩展阅读
- 为什么 Victoria Metrics 的 increase 可以得到整数 VictoriaMetrics: PromQL compliance - Roman Khavronenko - Medium2
- Design doc: Prometheus x-rate - Extended rate(), increase() and delta()
Blog - How Exactly Does PromQL Calculate Rates?
- https://promlabs.com/blog/2021/01/29/how-exactly-does-promql-calculate-rates
- PromLabs - Products and services around the Prometheus monitoring system to make Prometheus work for you
- 2023-01-16 18:05:22
Counters are a Prometheus metric type whose value only goes up, and which represent cumulative total counts like "How many requests have we handled in total?" or "How many seconds have we spent handling requests?" . Since the value of a counter depends on the initial (re)start time of a process that tracks and exposes it, the absolute value of a counter is almost never useful. So before graphing or doing anything else with a counter, you typically want to wrap it in a function like
rate(),irate(), orincrease() to see how fast the counter is going up.The exact behavior of those three functions is a frequent source of confusion, so in this post we will look in detail at each of them, and how they deal with counter resets and do extrapolation of data to give you a final value. Note that we will only look at the above-mentioned counter-related functions here. If you want to track the increase or decrease of a gauge metric, you will need to use the
delta() orderiv() functions for that instead. We will cover those in a future blog post.Overview
Here’s a high-level overview of the difference between the three functions for calculating the rate of increase of a counter:
-
rate(): This calculates the rate of increase per second, averaged over the entire provided time window. Example:rate(http_requests_total[5m]) yields the per-second rate of HTTP requests as averaged over a time window of 5 minutes. This function is the most common, as it yields a nicely smoothed rate with a predictable per-second output unit. -
irate() (“instant rate”): This calculates the rate of increase per second just likerate(), but only considers the last two samples under the provided time window for the calculation and ignores all earlier ones. Example:irate(http_requests_total[5m]) looks at the two last samples under the provided 5-minute window and calculates the per-second rate of increase between them. This function can be helpful if you want to make a zoomed-in graph show very quick responses to changes in a rate, but the output will be much more spiky than forrate(). -
increase(): This function is exactly equivalent torate() except that it does not convert the final unit to “per-second” (1/s). Instead, the final output unit is per-provided-time-window. Example:increase(http_requests_total[5m]) yields the total increase in handled HTTP requests over a 5-minute window (unit:1 / 5m). Thusincrease(foo[5m]) / (5 * 60) is 100% equivalent torate(foo[5m]).
All three functions share the requirement that they need at least two samples under the provided range window to work. Series that have less than two samples under the window are simply dropped from the result.
How exactly to calculate the increase given a fixed time window and some data points falling under that window is a matter of tradeoffs and imperfect approximations. Prometheus chooses an approach that aims to provide the most correct answer on average, given only the limited data under the provided window. Let’s look in more detail at how it does this:
What frequently confuses people is the extrapolating behavior of the
rate() andincrease() functions. As an example,increase() can return non-integer results like2.5883 even for counters that only have integer increments. The reason is thatincrease() tries to approximate the increase of a counter over the total duration of the specified time window (e.g. 5 minutes in the case ofincrease(foo[5m])). But in reality the first and last samples found under the time window will never coincide 100% with the start and end of the provided time window. Thusincrease() (and alsorate()) extrapolate the slope between those first and last data points under the window to the window boundaries, to arrive at a value that will on average be closer to the expected increase over the entire window (had there actually been samples precisely at the window boundaries).The following diagram shows an example of using
rate() with a 1-minute window and samples that are 15 seconds apart, with one actual counter increase by1 happening under the window:
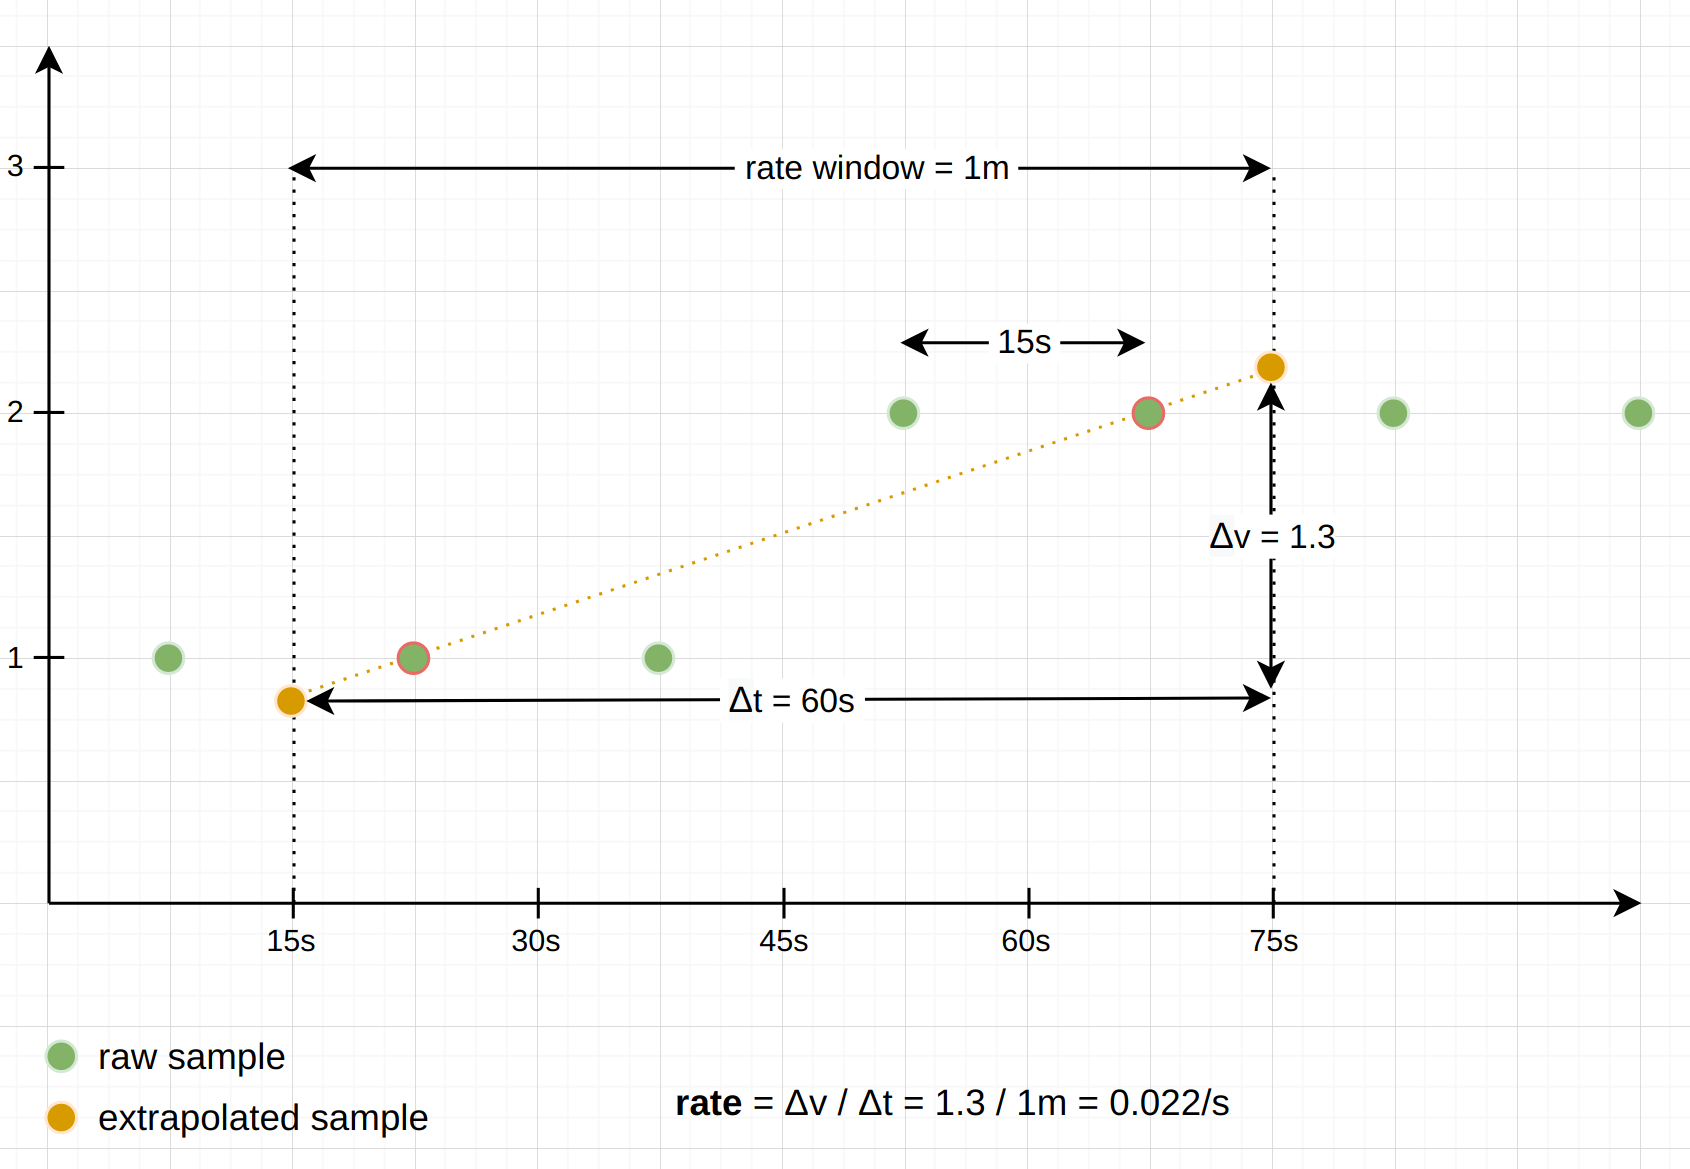
As you can see, the reported result is based on the slope between the first and last sample (almost true, see the next section about counter resets) under the window, and extrapolated to the window boundaries.
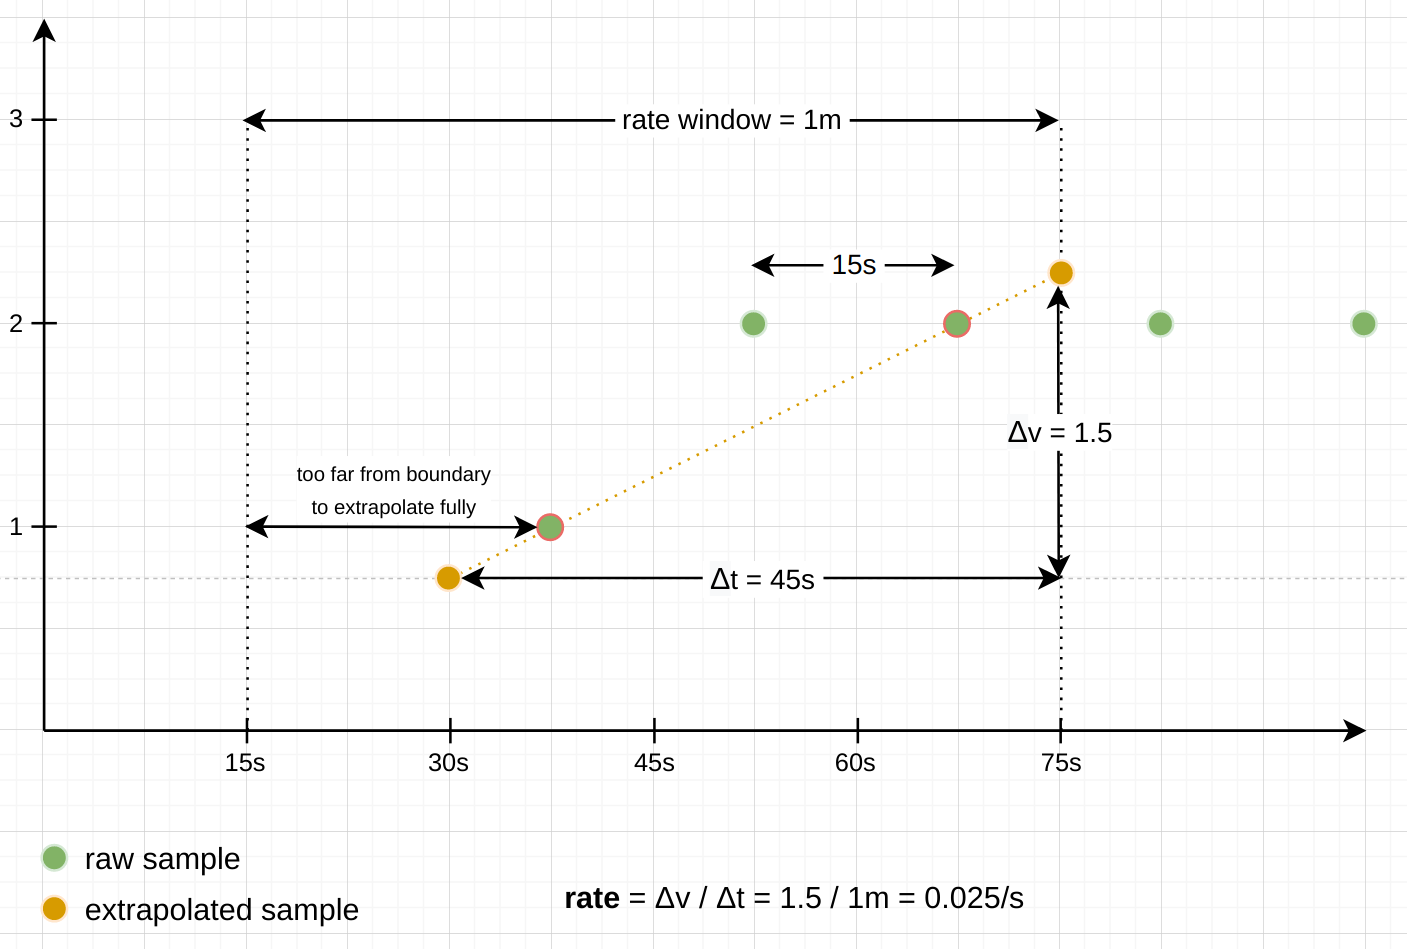
Note: There are some exceptions to this extrapolating behavior: When a series looks like it starts or ends under the provided time window, we do not want to extrapolate too far into the direction in which the series terminates. The
rate() andincrease() functions guess that a series starts or ends under the window when the first or last sample is farther away from its respective window boundary than 1.1x the average interval between the samples under the window. In that case, the extrapolation only extends half an average sample interval toward the window boundary, but not all the way. Similarly, the functions avoid extrapolating to a negative value, since counters always start at0 and can never be negative. Instead, the extrapolation only happens until the expected0 value is hit.
Since
irate() really only looks at the per-second increase between two samples, it does not do any of this extrapolation.Dealing with counter resets
Although counters normally only go up, they reset to
0 whenever a process that tracks them restarts. To not interpret these resets as actual negative rates, the counter-related functions have logic to detect and deal with those resets: when iterating over the samples under the provided time window, the functions check whether any sample has a lower value than the previous one, and interpret this situation as a counter reset. Using the further assumption that counters always start at0 after a reset, these functions then just add the new sample value to the previously seen one, to compensate for the reset.The following example diagram shows how a
rate() calculation deals with a counter reset happening under the provided window. You can imagine this asrate() creating a set of “virtual” samples from the underlying “real” samples. The final rate is then calculated from the virtual samples, as if the resets had never taken place:
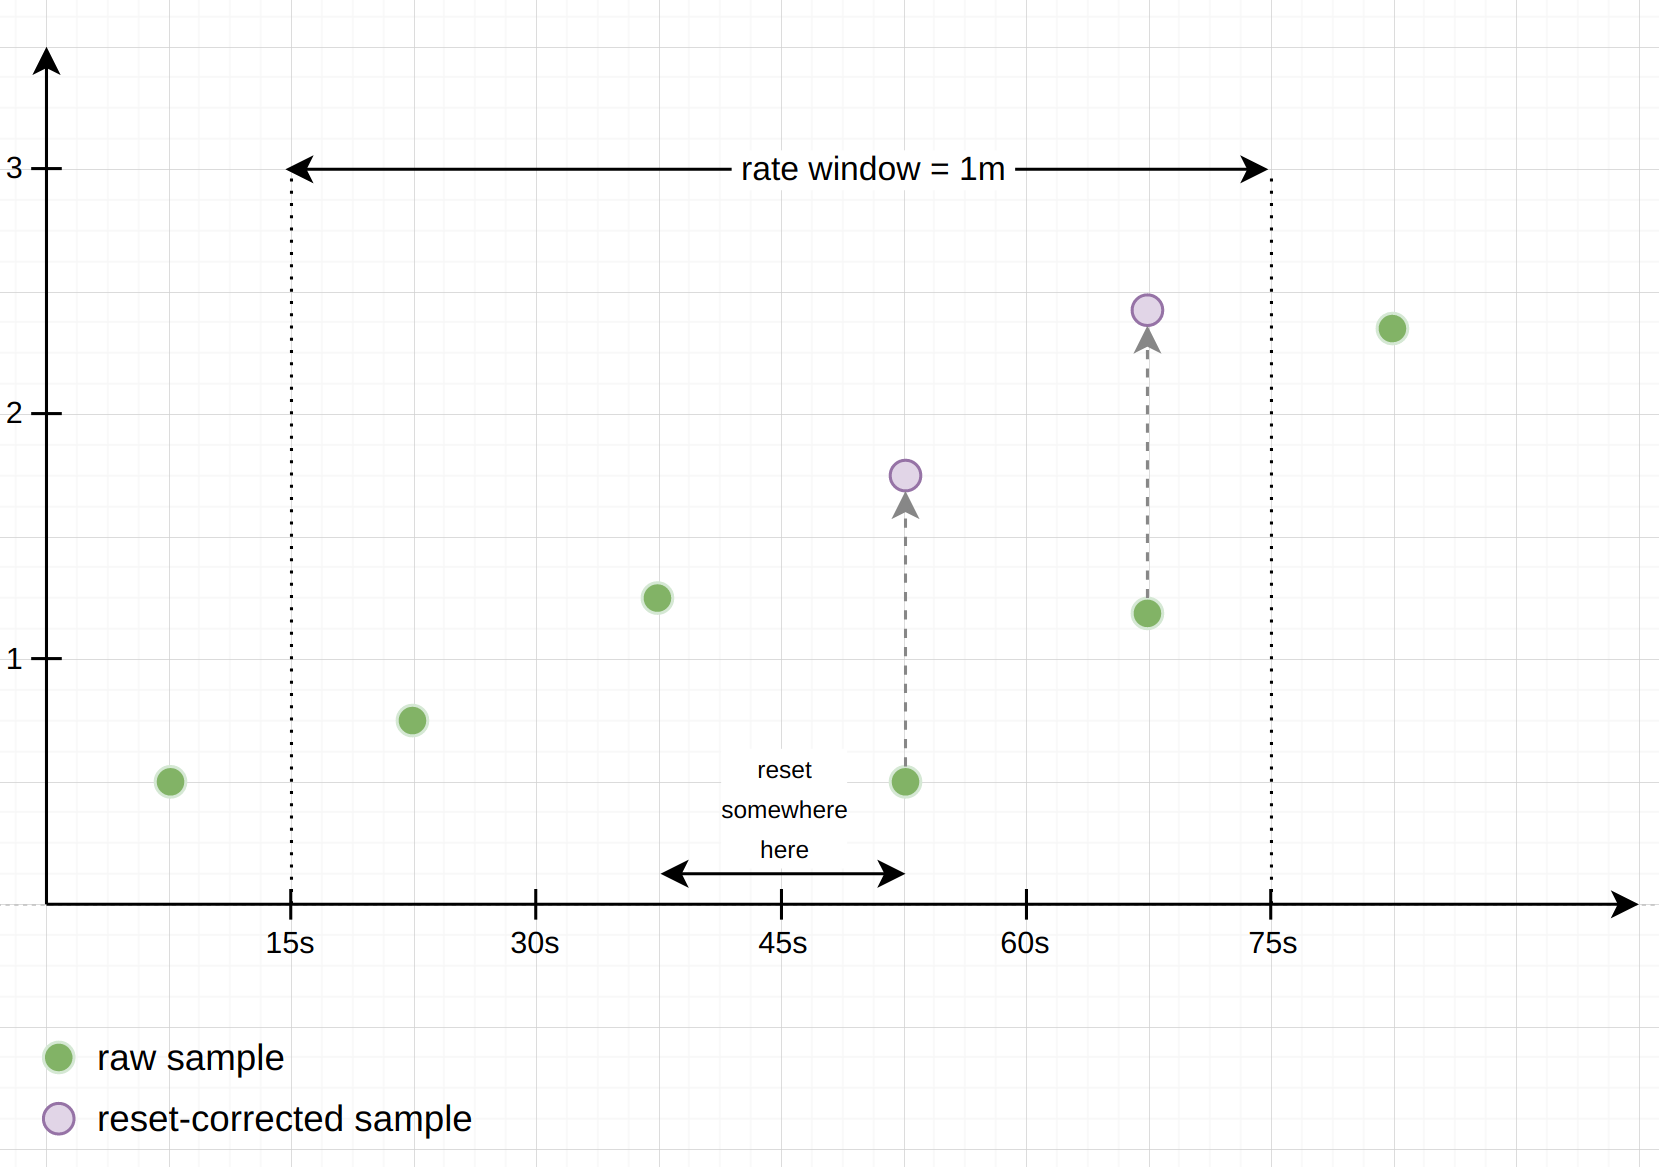
Note: Whenever a counter resets, there is the chance that it was incremented after Prometheus’s last scrape, but before the reset. Those increments are lost to Prometheus forever, and there is no way to get them back. To minimize this effect, resets should happen only once in a while, and much less frequently than Prometheus scrapes your target.
Conclusion
The inner workings and exact outputs of the various counter-related functions in PromQL can be confusing. In this post we aimed to shed light on how the
rate(),irate(), andincrease() functions deal with units, counter resets, and extrapolation. Hopefully this will give you a better understanding of their subtle behaviors. ↩︎ ↩︎VictoriaMetrics: PromQL compliance - Roman Khavronenko - Medium
- https://medium.com/@romanhavronenko/victoriametrics-promql-compliance-d4318203f51e - Medium
- MetricsQL is a query language inspired by PromQL. It is used as a primary query language in VictoriaMetrics, time series database and monitoring solution. MetricsQL claims to be backward-compatible…
- 2023-01-31 14:09:08
MetricsQL is a query language inspired by PromQL. It is used as a primary query language in VictoriaMetrics, time series database and monitoring solution. MetricsQL claims to be backward-compatible with PromQL, so Grafana dashboards backed by a Prometheus datasource should work the same after switching from Prometheus to VictoriaMetrics.
However, VictoriaMetrics is not 100% compatible with PromQL and never will be. Please read on and we will discuss why that is.
For a long time, there was no way to measure compatibility with PromQL. There was not even a fully defined PromQL specification. But, some time ago, the Prometheus Conformance Program was announced with the aim to certify software with a mark of compatibility with Prometheus — “Upon reaching 100%, the mark will be granted". The open-source tool, prometheus/compliance was created to check for compatibility.
Compatibility is measured in quite a simple way— the tool requires a configuration file with a list of PromQL queries to run, a Prometheus server to use as a reference and any other software meant to be tested. The tool sends PromQL queries to both Prometheus and the tested software, and if their responses don’t match — it marks the query as having failed.
Compliance testing
We ran compatibility testing between Prometheus v2.30.0 and VictoriaMetrics v1.67.0 and got the following result:
====================================================================
General query tweaks:
*  VictoriaMetrics aligns incoming query timestamps to a multiple of the query resolution step.
====================================================================
Total: 385 / 529 (72.78%) passed, 0 unsupported
According to the test, VictoriaMetrics failed 149 tests and was compatible with Prometheus by 72.59% of the time. Let’s take a closer look at the queries that failed.
Keeping metric name
According to PromQL, functions that transform a metric’s data should drop the metric name from the result, since the meaning of the initial metric has changed. However, this approach has some drawbacks. For example, the
max_over_time function calculates the max value of the series without changing its physical meaning. Therefore, MetricsQL keeps the metric name for such functions. It also enables queries over multiple metric names:max_over_time({__name__=~"process_(resident|virtual)_memory_bytes"}[1h]). While in PromQL such query fails withvector cannot contain metrics with the same labelset error.Hence, test suit functions like
*_over_time,ceil ,floor ,round ,clamp_* ,holt_winters ,predict_linear in VictoriaMetrics do intentionally contain the metric name in the results:QUERY: avg_over_time(demo_memory_usage_bytes[1s]) - Metric: s`{instance="demo.promlabs.com:10002", job="demo", type="buffers"}`, + Metric: s`demo_memory_usage_bytes{instance="demo.promlabs.com:10002", job="demo", type="buffers"}`,There were 92 (~17% of 529 tests total) such queries in the test suite which failed because the metric name is present in the response from VictoriaMetrics, while the values in the response are identical. VictoriaMetrics isn’t going to change this behavior as their users find this is more logical and rely on it.
Better rate()
rate andincrease functions are some of the most frequently used functions in PromQL. While the logic behind these two is relatively simple and clear, the devil is in the details.MetricsQL intentionally has a slightly different implementation of
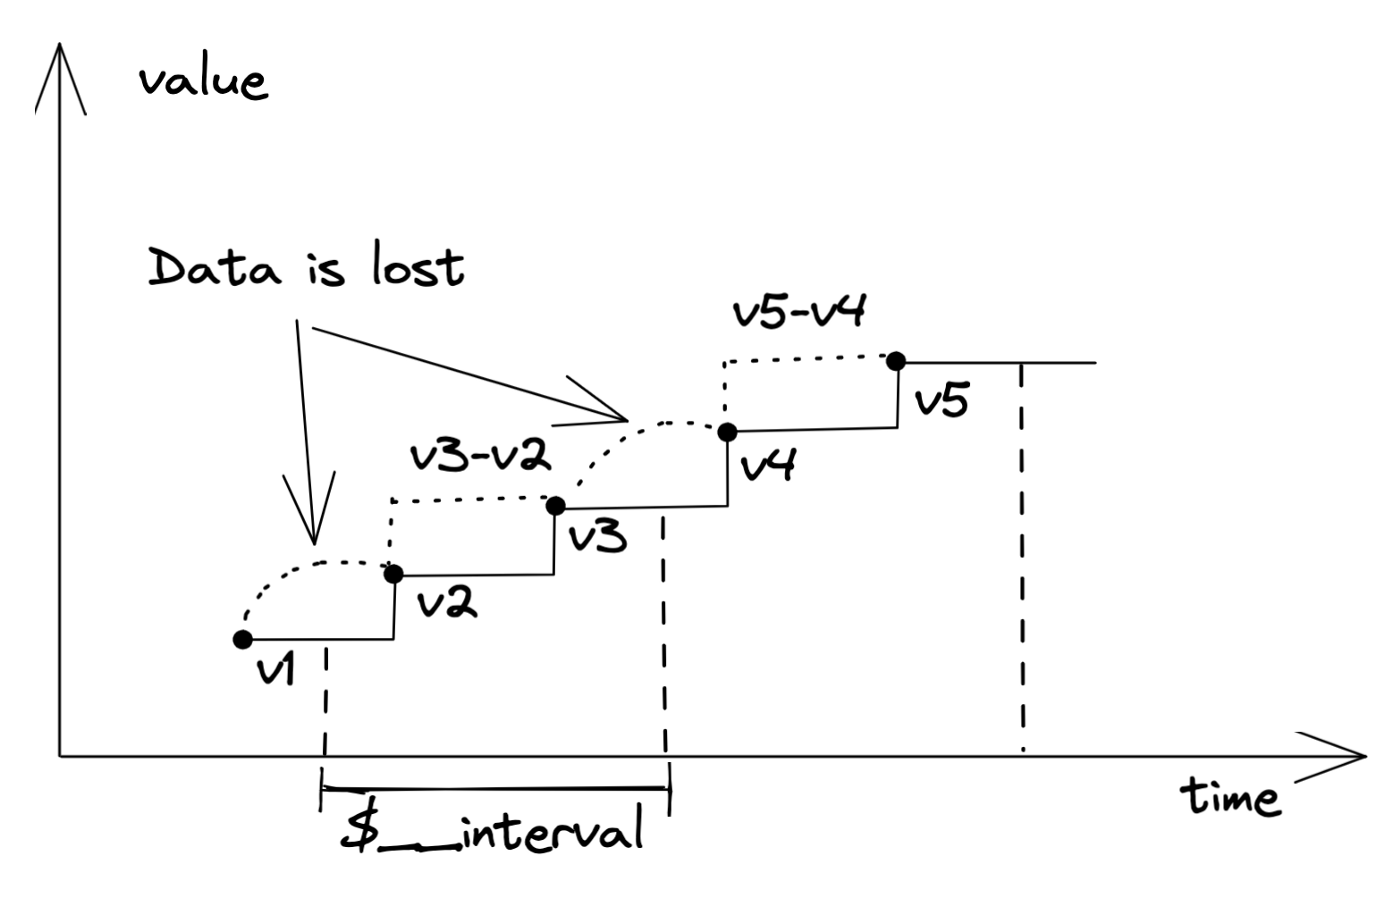
rate andincrease . It takes into account the last sample on the previous interval which allows capturing all the information from the time series when calculatingrate orincrease:
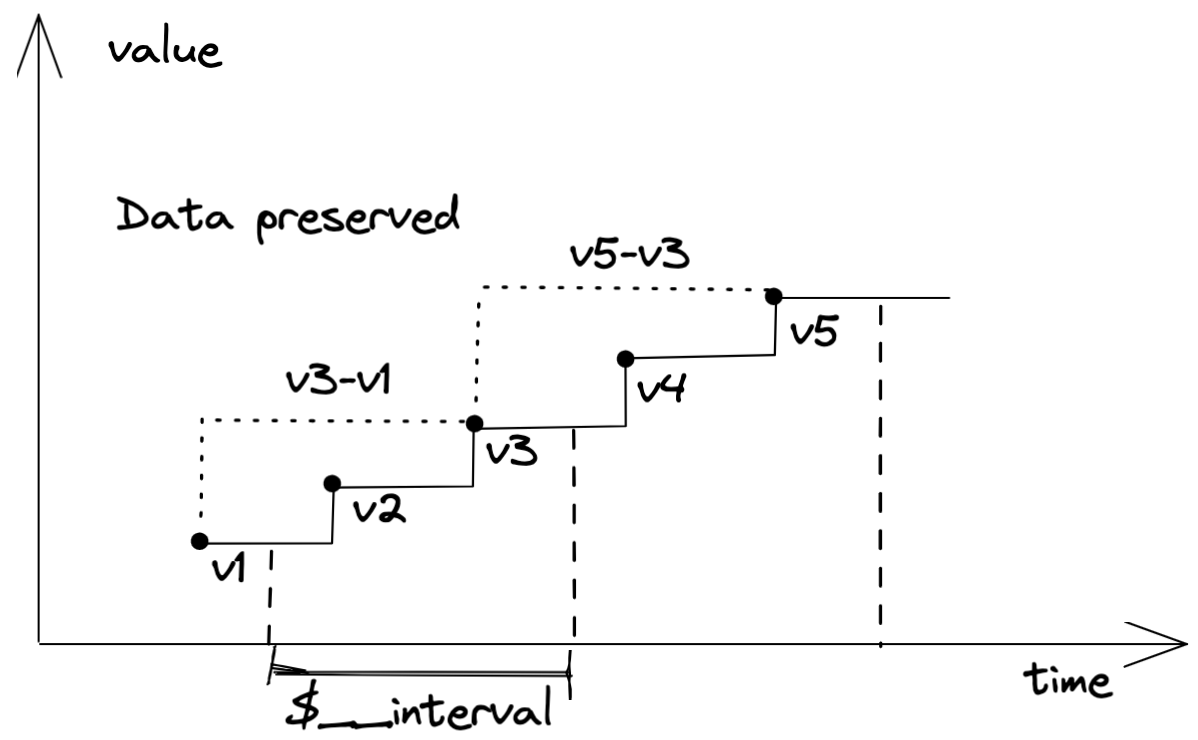
VictoriaMetrics captures the last data point from the previous interval when calculating increase()
Prometheus, in this case, loses the metric increase from the last sample in the previous interval and the first sample of the current interval:
Prometheus accounts only for points captured by the interval when calculating increase(), losing the data that was before it.
Additionally, MetricsQL automatically increases the interval in square brackets (aka lookbehind window) if there aren’t enough samples in the interval for calculating
rate andincrease. This solves the issue of unexpected "No Data" errors when zooming in.MetricsQL doesn’t apply extrapolation when calculating
rate andincrease. This solves the issue of fractionalincrease() results over integer counters:
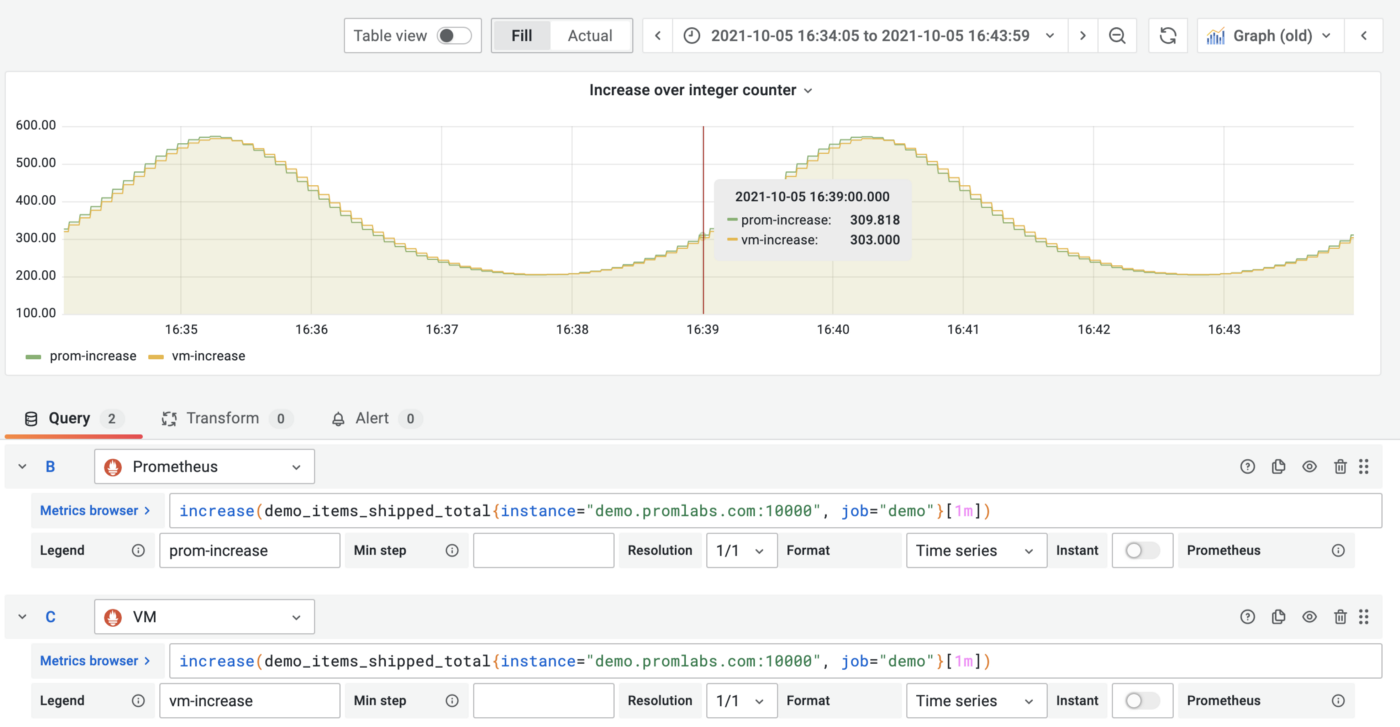
increase() query over time series generated by integer counter results in decimal values for Prometheus due to extrapolation.
It is quite important to choose the correct lookbehind window for
rate andincrease in Prometheus. Otherwise, incorrect or no data may be returned. Grafana even introduced a special variable $__rate_interval to address this issue, but it may cause more problems than it solves:- Users need to configure the scrape interval value in datasource settings to get it to work;
- Users still need to add
$__rate_interval manually to every query that usesrate; - It won’t work if the datasource stores metrics with different scrape intervals (e.g. global view across multiple datasources);
- It only works in Grafana.
In MetricsQL, a lookbehind window in square brackets may be omitted. VictoriaMetrics automatically selects the lookbehind window depending on the current step, so
rate(node_network_receive_bytes_total) works just asrate(node_network_receive_bytes_total[$__interval]). And even if the interval is too small to capture enough data points, MetricsQL will automatically expand it. That’s why queries likederiv(demo_disk_usage_bytes[1s]) return no data for Prometheus and VictoriaMetrics expands the lookbehind window prior to making calculations.There are 39 (~7% of 529 tests total) queries (rate, increase, deriv, changes, irate, idelta, resets, etc.) exercising this logic which cause the difference in results between VictoriaMetrics and Prometheus:
QUERY: rate(demo_cpu_usage_seconds_total[5m])
-           Value:     Inverse(TranslateFloat64, float64(1.9953032056421414)),
+           Value:     Inverse(TranslateFloat64, float64(1.993400981075324)),
For more details about how rate/increase works in MetricsQL please check docs and example on github.
NaNs
NaNs are unexpectedly complicated. Let’s begin with the fact that in Prometheus there are two types of NaNs: normal NaN and stale NaN. Stale NaNs are used as “staleness makers” — special values used to identify a time series that had become stale. VictoriaMetrics didn’t initially support this because VictoriaMetrics needed to integrate with many systems beyond just Prometheus and had to have a way to detect staleness uniformly for series ingested via Graphite, Influx, OpenTSDB and other supported data ingestion protocols. Support of Prometheus staleness markers was recently added.
Normal NaNs are results of mathematical operations, e.g.
0/0=NaN. However, in OpenMetrics there is no special meaning or use case for NaNs.While NaNs are expected when evaluating mathematical expressions, it is not clear how useful they are for users, or if there are any benefits to return NaNs in the result. It looks like the opposite is true because users are oftenconfusedwith the receivedresults.
MetricsQL consistently deletes NaN from query responses. This behavior is intentional because there is no meaningful way to use such results. That’s why testing queries such as
demo_num_cpus * NaN orsqrt(-demo_num_cpus) return an empty response in MetricsQL, and returns NaNs in PromQL.There were 6 (~1% of 529 tests total) queries in thetest suite expecting NaNs in responses:
sqrt(-metric) ,ln(-metric) ,log2(-metric) ,log10(-metric) andmetric * NaN .Negative offsets
VictoriaMetrics supports negative offsets and Prometheus also does as well starting with version 2.26 if a specific feature flag is enabled. However, query results are different even with the enabled feature flag due to the fact that Prometheus continues the last value of the metric during the additional 5min:
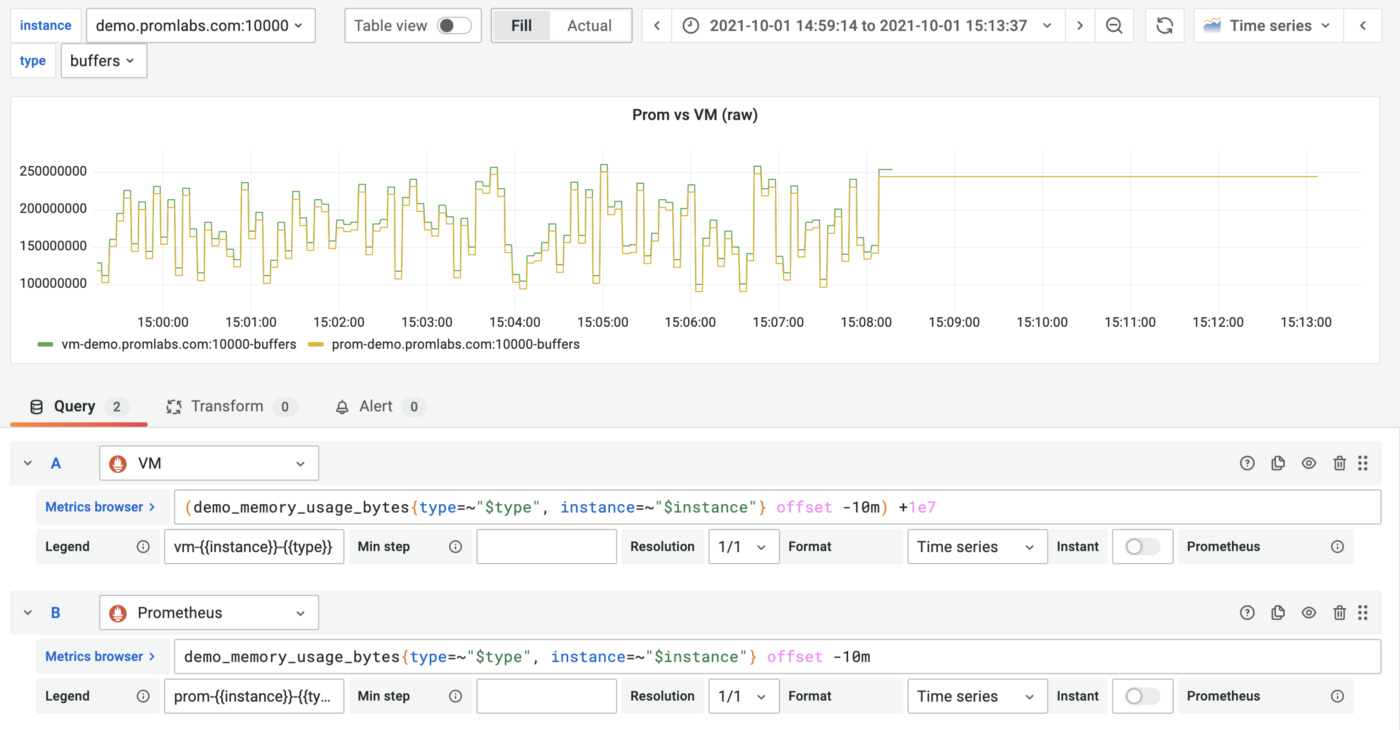
VictoriaMetrics vs Prometheus negative offset query. VictoriaMetrics response value is shifted by 1e7 to show the difference between the lines visually. Without this shift, they are identical except the last 5min.
Such behavior was unexpected to us. To get more details about it please check the following discussion:
VictoriaMetrics isn’t going to change the logic of negative offsets because this feature was released 2 years before Prometheus did it and users rely on that.
There were 3 (~0.5% of 529 tests total) queries for -1m, -5m, -10m offsets in the test suite:
QUERY: demo_memory_usage_bytes offset -1m
RESULT: FAILED: Query succeeded, but should have failed.
Precision loss
VictoriaMetrics fails the following test case:
QUERY: demo_memory_usage_bytes % 1.2345
  Timestamp: s"1633073960",
- Value: Inverse(TranslateFloat64, float64(0.038788650870683394)),
+ Value: Inverse(TranslateFloat64, float64(0.038790081382158004)),
The result is indeed different. It is off on the 5th digit after the decimal point and the reason for this is not in MetricsQL but in VictoriaMetrics itself. The query result isn’t correct because the raw data point value for this specific metric doesn’t match between Prometheus and VictoriaMetrics:
curl http://localhost:9090/api/v1/query --data-urlencode 'query=demo_memory_usage_bytes{instance="demo.promlabs.com:10000", type="buffers"}' --data-urlencode 'time=1633504838'
..."value":[1633504838,"148164507.40843752"]}]}}%                                                                                  curl http://localhost:8428/api/v1/query --data-urlencode 'query=demo_memory_usage_bytes{instance="demo.promlabs.com:10000", type="buffers"}' --data-urlencode 'time=1633504838'
..."value":[1633504838,"148164507.4084375"]}]}}%
VictoriaMetrics may reduce the precision of values with more than 15 decimal digits due to the used compression algorithm. If you want to get more details about how and why this happens, please read the “Precision loss” section in Evaluating Performance and Correctness. In fact, any solution that works with floating point values has precision loss issues because of the nature of floating-point arithmetic.
While such precision loss may be important in rare cases, it doesn’t matter in most practical cases because the measurement error is usually much larger than the precision loss.
While VictoriaMetrics does have higher precision loss than Prometheus, we believe it is completely justified by the compression gains our solution generates. Moreover, only 3 (~0.5% of 529 tests total) queries from the test suite fail due to precision loss.
Query succeeded, but should have failed
The following query fails for PromQL but works in MetricsQL:
QUERY: {__name__=~".*"}
RESULT: FAILED: Query succeeded, but should have failed.
PromQL rejects such a query to prevent database overload because query selects all the metrics from it. At the same time, PromQL does not prevent a user from running an almost identical query
{__name__=~".+"} , which serves the same purpose.The other example of a failing query is the following:
QUERY: label_replace(demo_num_cpus, "~invalid", "", "src", "(.*)")
RESULT: FAILED: Query succeeded, but should have failed.
The query fails for PromQL because it doesn’t allow using
~ char in label names. VictoriaMetrics accepts data ingestion from various protocols and systems where such char is allowed, so it has to support a wider list of allowed chars.There were ** 2 (~0.3% of 529 tests total)** queries that failed because of incompatibility but we can’t imagine a situation where it would harm a user’s experience.
Summary
There are differences between MetricsQL and PromQL. MetricsQL was created long after the PromQL with the goal of improving the user experience and making the language easier to use and understand.
How compatibility is measured in the Prometheus Conformance Program isn’t ideal because it really only shows if the tested software uses Prometheus PromQL library under the hood or not. This is particularly complicated for solutions written in programming languages other than Go.
By the way, the percentage of failing tests is easy to increase or decrease by changing the number of range intervals (e.g. 1m, 5m etc.) in tests. In the case of VictoriaMetrics, about 90 tests have failed not because of wrong calculations, but because of the metric name present in the response. Of course, there is no ideal way to be fair to everyone. That’s why this post exists to explain the differences.
We also want to say a big thank you to Julius Volz, the author of these compliance tests. Thanks to his work and patience we were able to fix most of the real incompatibility issues in MetricsQL.
↩︎